A Portable Kubernetes Audit Trail: Who Changed What

You trigger pipelines. You update a GitServer, promote a deployment, adjust a Codebase. Much of that flows through GitOps and lands in your Git history - but not all of it. Some changes you make directly against the cluster, from the portal or kubectl, because that's the quickest way to get something done. That's normal, everyday platform work. What's harder is answering a fair question that comes up afterward: what changed, when, and who made the change? - especially for the changes that never went through a pull request.
On managed Kubernetes the raw answer exists - the API server writes an audit record for every request - but getting to it is another story. On Amazon EKS those records stream to CloudWatch. Answering a simple operational question then means writing a Logs Insights query, knowing the retention window, and having the right IAM. Great for a SIEM pipeline; heavy for a Tuesday-afternoon "what just changed?". KubeRocketCI ships a lighter, portable alternative called krci-audit - a self-contained, queryable audit trail that works the same on EKS, on-prem, or a local kind cluster. The catch, which most of this post is about: an audit trail is not free, so you should be deliberate about what you capture.
Here's the reasoning - why native audit logs leave a gap for day-to-day questions, how krci-audit fills it without a cloud dependency, the performance trap of auditing everything (with real numbers from a running cluster), and where this is going next.
Why Aren't Native Kubernetes Audit Logs Enough for "Who Changed What?"
Short answer: they're built for security forensics and SIEM, not for a quick operational lookup. The data exists - every managed Kubernetes distribution can emit API server audit logs, a structured record of who called the API, what they changed, and when. On EKS you enable the audit log type and the control plane ships it to CloudWatch Logs. As a foundation that's exactly right: immutable, comprehensive, centrally retained, and easy to alert on.
But for operational questions it has friction:
- Quick access is a query, not a lookup. "Who created this PipelineRun?" becomes a CloudWatch Logs Insights query against a large, verbose stream - filtered by
objectRef,verb, and time - not a one-line answer. - It's cloud-locked. The retrieval path on EKS (CloudWatch), on AKS (Azure Monitor), and on-prem (a file sink you wire up yourself) are all different. Your runbook doesn't port.
- It's undifferentiated. The native stream captures everything the audit policy allows - most of which is control-plane noise you'll never ask about (more on that below).
- It lives outside your platform. Developers using the KubeRocketCI portal can't see "who triggered this run" without leaving the tool and querying a cloud console they may not have access to.
None of this makes native audit logging wrong - it makes it the wrong tool for the quick, in-platform question. That's the gap krci-audit targets.
How Does krci-audit Give You a Portable Audit Trail?
It captures a scoped set of admission changes inside your cluster and makes them instantly queryable - no dependency on any cloud provider's logging service. krci-audit is a small, self-contained component that does exactly that.
A resource change hits a validating admission webhook, which ships the record through Vector into an append-only PostgreSQL table; a read-only API then serves it to the portal and other consumers. The pieces:
| Component | Role |
|---|---|
| Capture | A ValidatingWebhookConfiguration (backed by kube-audit-rest) receives the AdmissionReview for each matching change. It runs with failurePolicy: Ignore and a 1-second timeout, so it never blocks a platform operation. |
| Ship | A Vector sidecar tails the capture log, keeps only the events you asked for, and writes them to PostgreSQL. |
| Store | A dedicated PostgreSQL database holds events in a monthly-partitioned, append-only table. Writes use a least-privilege role that cannot update or delete existing rows. |
| Read API | A separate, read-only service exposes initiator lookup and a filterable events query. It connects as a SELECT-only role, so the read path can never alter the trail. |
Because the whole thing runs inside your cluster, the experience is identical on EKS, AKS, GKE, OpenShift, or a laptop kind cluster - the same install, the same API, the same portal feature. It's an add-on, off by default, that you turn on when you have a reason to.
Why Shouldn't You Audit Everything?
Because an admission webhook sits in the write path of the API server - so a catch-all policy taxes every write and buries the trail in noise. Every request matching the webhook's rules is paused, sent to the webhook, and awaited (within the timeout) before the write completes. Point it at * - all resources - and you pay that cost on everything.
How much noise? To put real numbers on it, I measured the local try-kuberocketci testbed - a single-node kind cluster (Kubernetes v1.36.1) running the full platform and otherwise idle. Comparing each Lease object's resourceVersion over a 30-second window shows the churn a catch-all audit policy would capture (reproduce it with kubectl get leases -A, twice, 30 seconds apart):
- 31
Leaseobjects, and all 31 changed within those 30 seconds - pure leader-election heartbeat traffic. Extrapolated: ~3,720LeaseUPDATE admissions per hour, none of which anyone will ever audit. - And that's before
Events(13),EndpointSlices(50),Pods(54), andConfigMaps(122) - all high-churn, all captured by a*policy.
Now compare that to the scoped trail the same testbed actually recorded over ~36 hours, using krci-audit's default configuration (shown below):
| Resource | Events |
|---|---|
| PipelineRuns | 97 (71 UPDATE, 18 DELETE, 8 CREATE) |
| CodebaseBranches | 12 |
| GitServers | 4 |
| CodebaseImageStreams | 2 |
| CDStageDeployments / Stages | 3 |
That's 118 meaningful events over a day and a half - roughly 80 a day - versus ~3,720 an hour of lease noise from a single un-scoped resource type. A catch-all policy would be on the order of a thousand times larger, almost entirely with records no one wants.
The design that avoids this: scope at the webhook rules, not downstream. When a resource isn't in the rules, the API server never calls the webhook at all - zero added latency, zero stored noise. krci-audit's default rules capture only what the platform cares about:
capture:
  failurePolicy: Ignore   # never block a platform operation
  timeoutSeconds: 1
  rules:
    - apiGroups: ["v2.edp.epam.com"]   # KubeRocketCI CRDs
      resources: ["*"]
    - apiGroups: ["tekton.dev"]
      resources: ["pipelineruns"]
  level: metadata          # capture object metadata, not full bodies (bounds size and PII)
The guidance is simple: audit with a goal, not by default. Decide what question you need the trail to answer - "who triggered pipelines", "who touched Git server config", "who deleted deployments" - and capture those resources. You can widen the filter later with a helm upgrade; you can't un-spend the latency budget you burned auditing lease renewals.
How Do You See Who Triggered a Pipeline?
The KubeRocketCI portal shows a "Triggered By" field on the PipelineRun details page - the first thing krci-audit powers, answering a question every platform user eventually asks: who started this run?
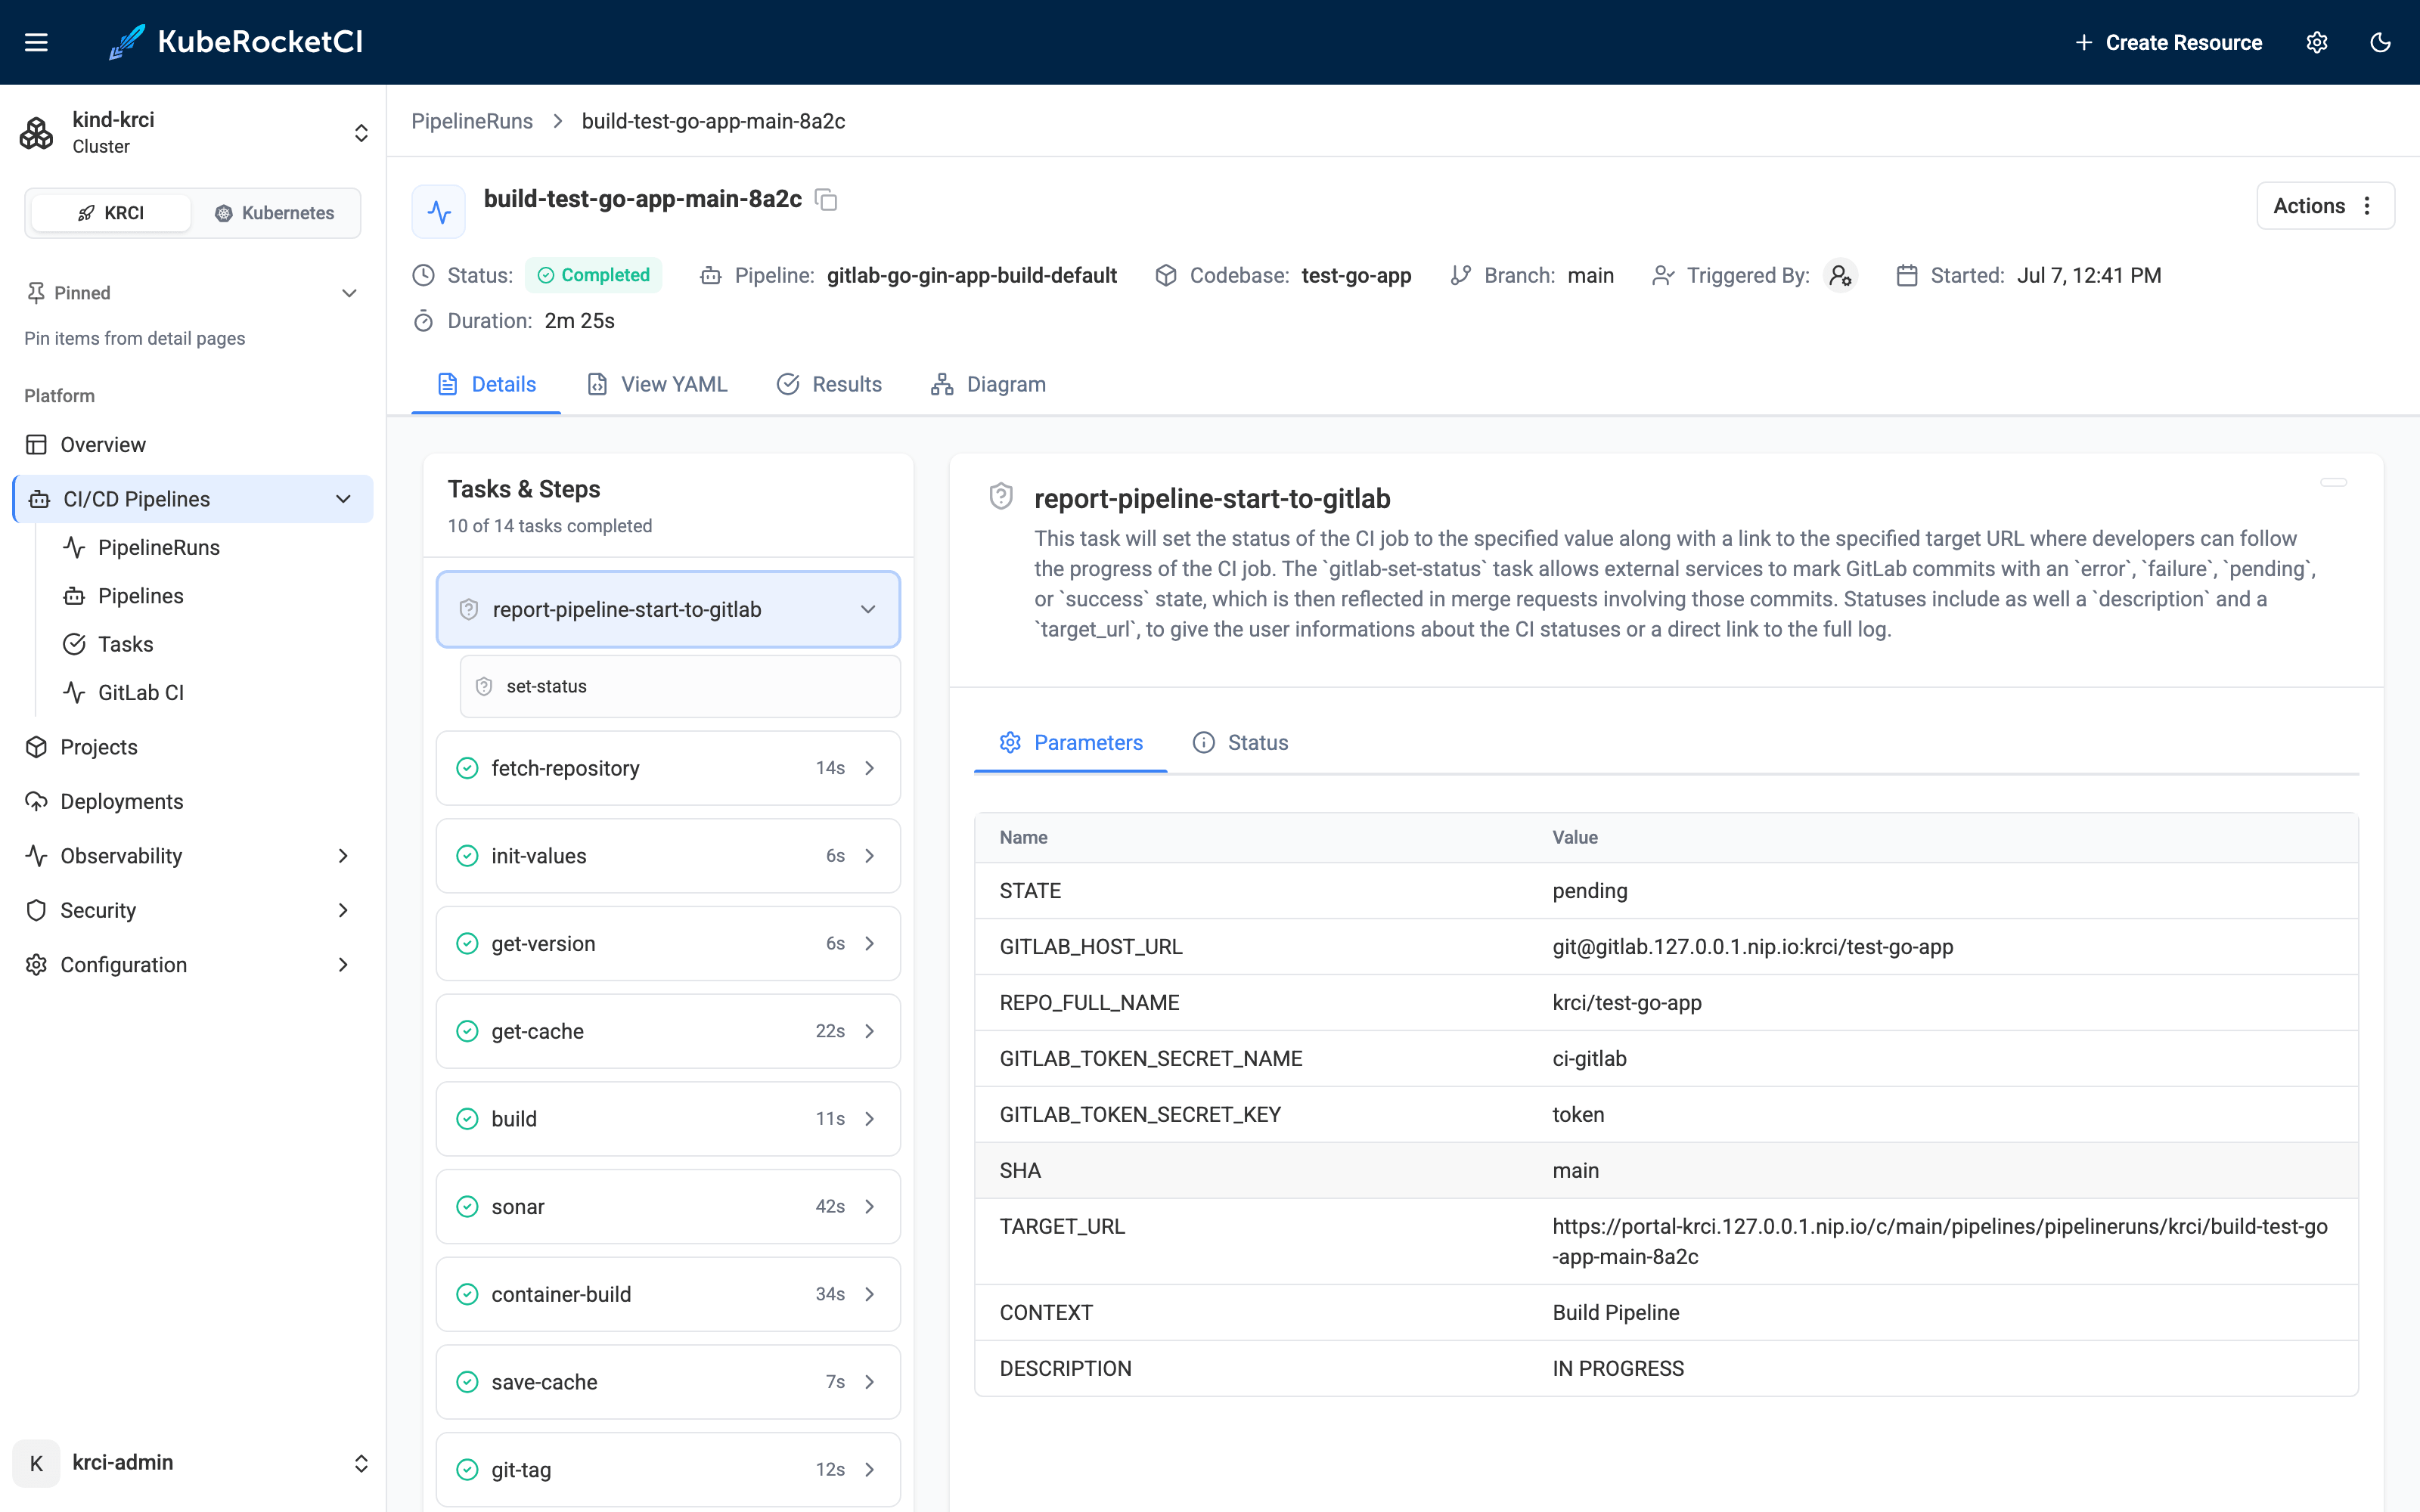
It resolves the run's creator from the audit trail and classifies them:
- A human user (for runs started from the portal), or
- An automation identity - the service account behind a Git webhook or scheduled build (as shown above), or
- N/A, when the initiator can't be resolved (for example, historical runs created before auditing was enabled).
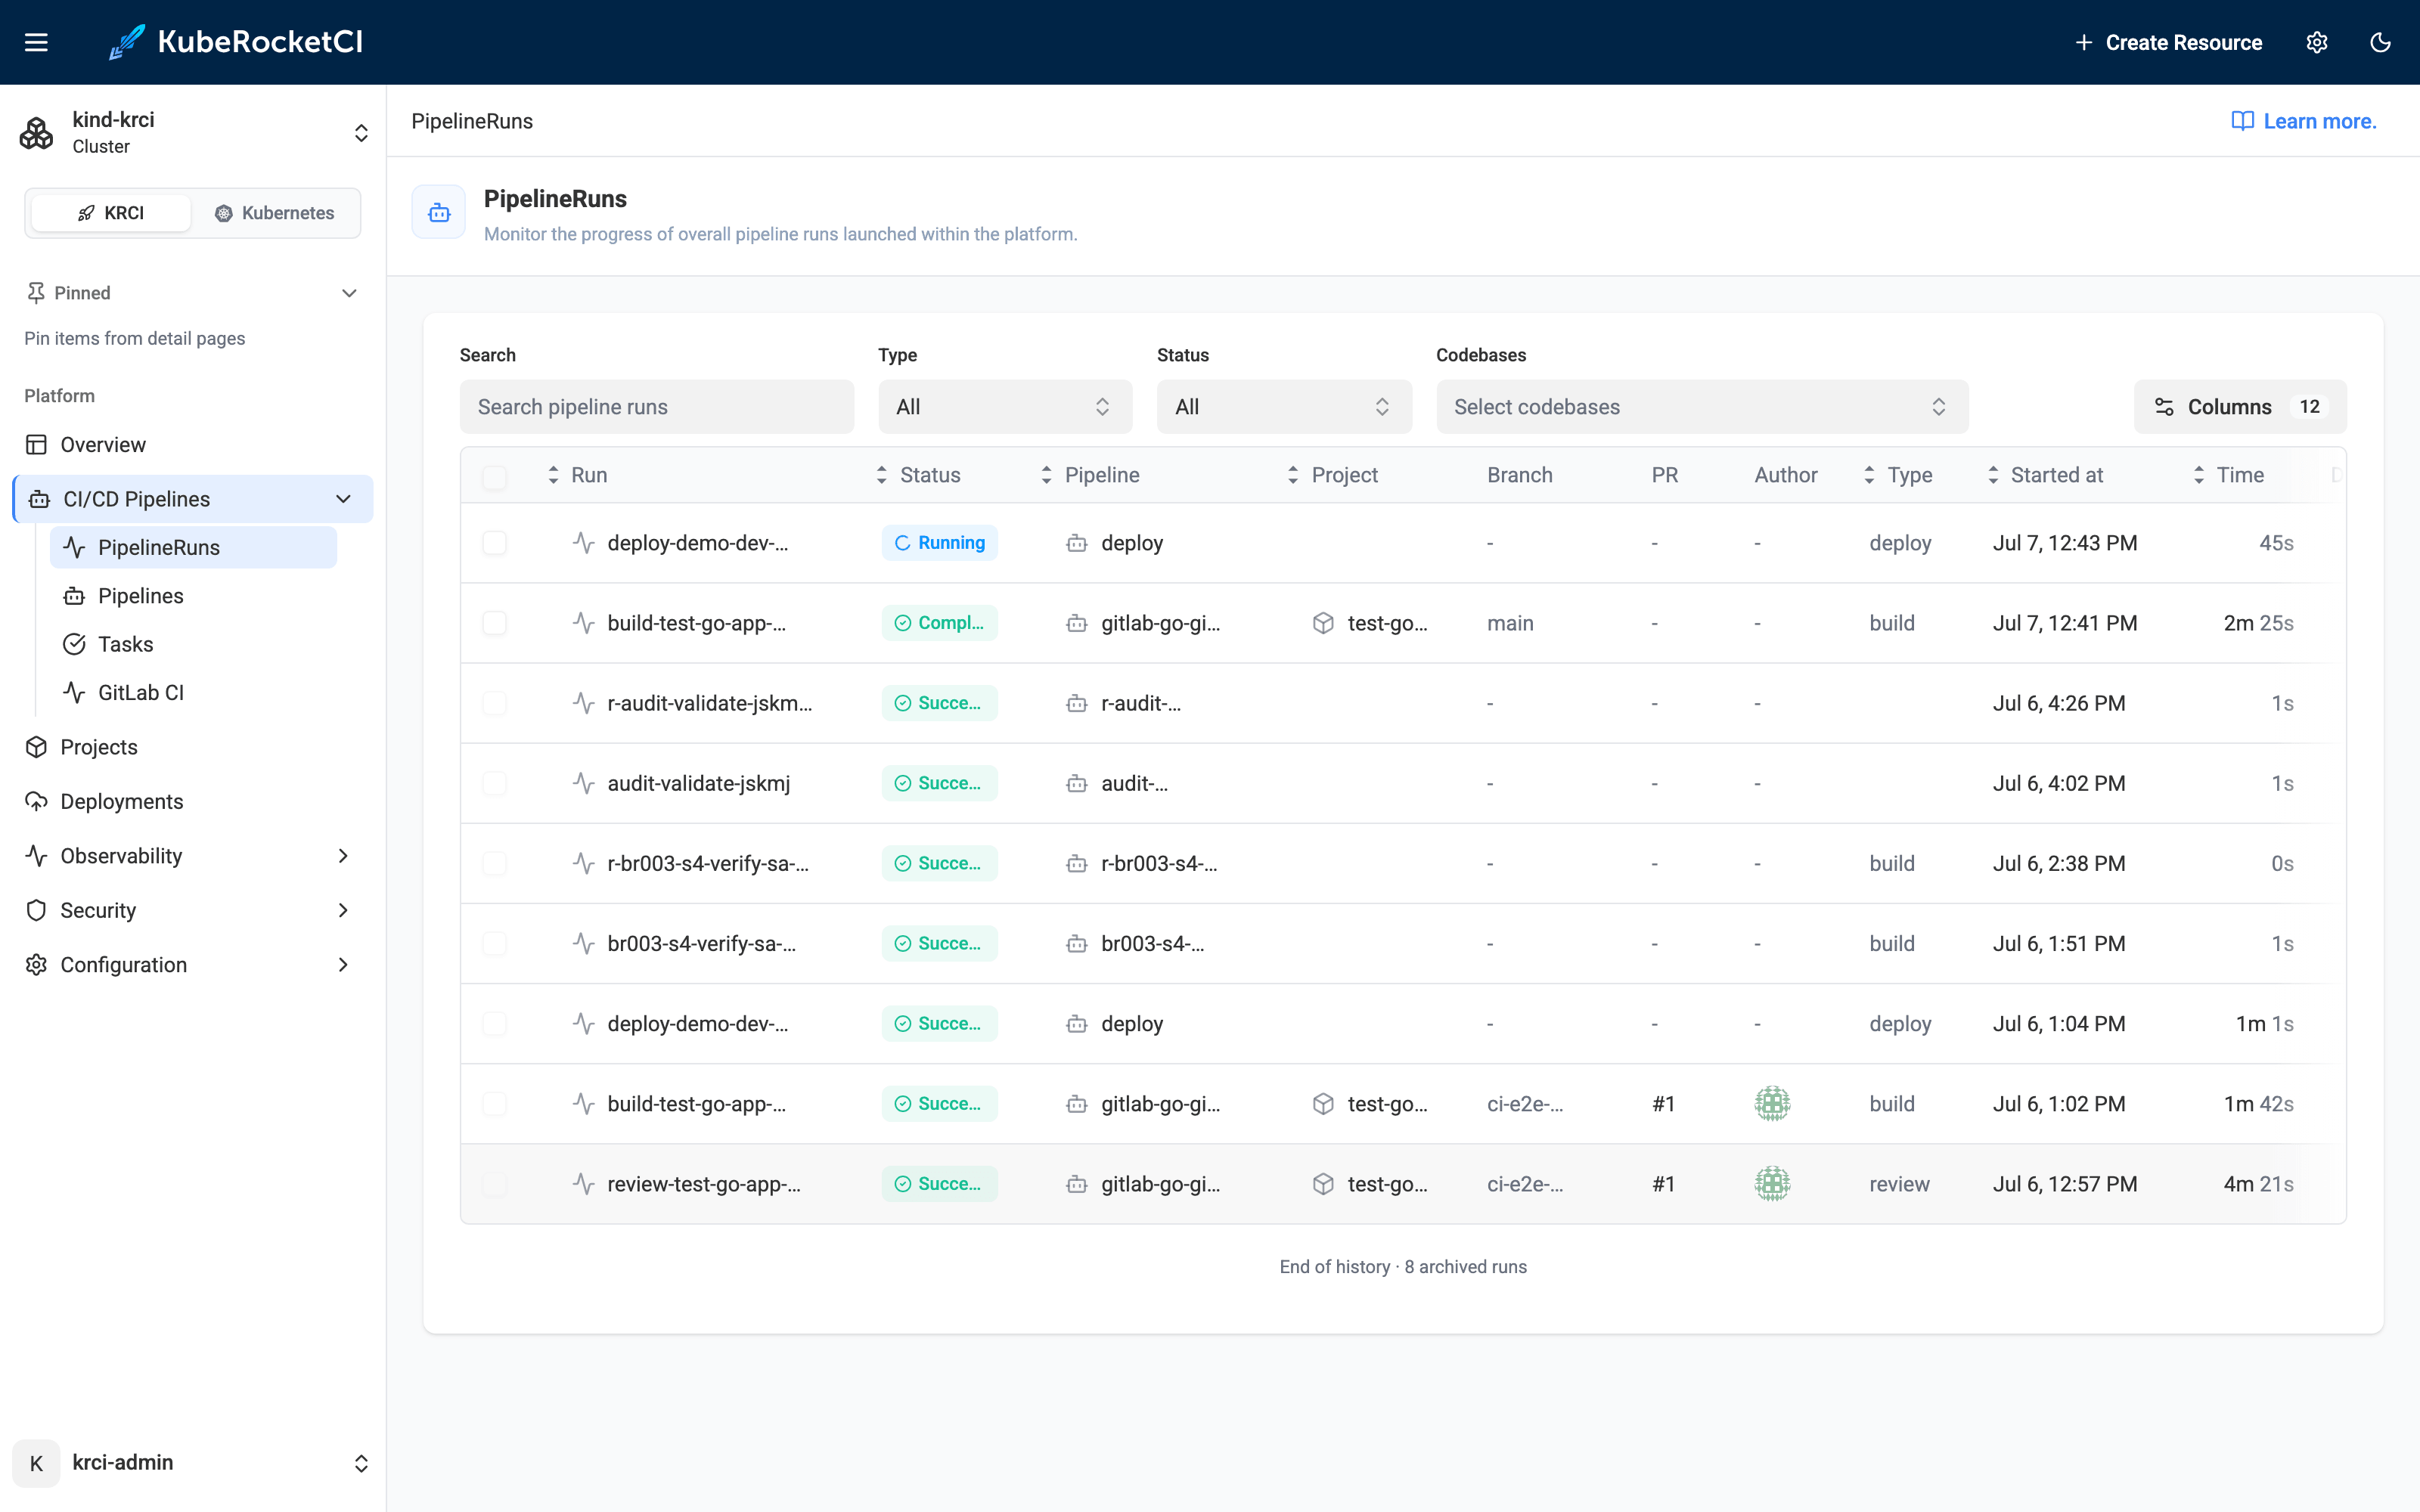
It's deliberately distinct from the existing Author column, which shows the Git commit author. The person who wrote the code is not always the identity that launched the run. Under the hood the portal calls the krci-audit read API with the run's kind, namespace, and name; no extra annotations, no changes to how pipelines are created.
How Do You Query the Audit Trail Directly?
Through a plain HTTP API - the same data the portal uses, handy for incident triage, scripts, and compliance exports. It's a ClusterIP service (in-cluster only), so port-forward it to try from your workstation:
kubectl -n krci-audit port-forward svc/krci-audit-api 18080:8080
"Who created this resource?" - an initiator lookup by kind, namespace, and name:
curl "http://localhost:18080/api/v1/audit/initiator?kind=PipelineRun&namespace=krci&name=build-test-go-app-main-8a2c"
{
  "actor": "system:serviceaccount:krci:krci-admin",
  "operation": "CREATE",
  "found": true,
  "timestamp": "2026-07-07T09:41:13Z"
}
"What happened to this kind of object?" - a filterable, paginated events query (by kind, operation, actor, time):
curl "http://localhost:18080/api/v1/audit/events?kind=PipelineRun&operation=DELETE&limit=20"
Real questions this answers without a cloud console:
- "Who deleted my Codebase last night?" - filter by
operation=DELETEand the object. - "Show me everything this service account did." - filter by
actor; the same query backs a user's own activity view. - "Produce the change history for this resource for an audit." - export the filtered result.
Because the store is append-only and time-stamped, it doubles as compliance evidence: an immutable record of who changed what. It maps cleanly to SOC 2, ISO 27001, GDPR, and PCI DSS change-tracking controls, and it's retrievable through the API without handing anyone direct database access.
When Should You Still Use Native Audit and SIEM?
When you need cluster-wide forensics, tamper-proof off-cluster retention, or cross-signal correlation - keep shipping the API server audit log to your SIEM. To be clear about scope: krci-audit complements native audit logging, it doesn't replace a security program. krci-audit is for the operational, in-platform question - fast, portable, developer-facing "who/what/when" - not the security org's system of record.
Future Work
This is the first slice of a broader capability. Next up:
- Authentication and authorization on the API. Today the read API is unprotected and reachable only in-cluster (ClusterIP, no Ingress), with network scope as the interim boundary. Role-based access - so the trail respects who's allowed to see what - is the next milestone.
- "Who changed what" across every object, in the portal. The initiator today is surfaced for PipelineRuns; the same audit data can enrich every KubeRocketCI resource - a change history and last-modified-by on Codebases, environments, Git servers, and more - turning the portal into a single place to answer accountability questions for the whole platform.
Next Steps
- Operators: follow the Audit Trails Setup guide to enable the add-on, choose what to capture, and set retention.
- Users: see the Pipelines Overview for the Triggered By field in context.
- New to the platform? Start with What is KubeRocketCI or try it locally.
Audit trails are one of those features that's invisible until the moment you need it - and then it's the only thing that matters. Turn it on with a goal, keep it scoped, and it'll answer "who changed what?" in one call instead of one afternoon.