krci CLI: From Terminal to AI Agents

Most of my day-to-day platform work happens in a conversation. I sit in a Claude Code session - or any AI assistant with shell access - and ask plain-language questions about the state of our delivery cluster: what's failing, what's drifting, what's vulnerable, what's stale. The agent answers by calling the krci CLI, the predictable, JSON-emitting client over the KubeRocketCI Portal's tRPC API. I read the answer, decide what to do, and when a question turns into a routine I drop the underlying invocation into a script and let it run on cron or /loop. This post is a snapshot of that workflow with one running example - operator vulnerability status - and a tour of the other questions the same pattern answers.
Workflows, Not Sessions
KubeRocketCI is built so the platform's primitives are reachable from every runtime that matters in modern engineering: the portal, the CLI, Tekton pipelines, GitLab CI, schedulers, and AI agents. A workflow I write once runs everywhere it needs to:
- Pipelines. A
krciinvocation that answers a question in my terminal runs unchanged inside a Tekton task or a GitLab CI job. Quality gates and release governance read live platform state without bespoke API clients. - Schedulers. A short bash wrapper in cron, or a Kubernetes CronJob produces a daily report on a hands-off cadence - same command, same output, same trust boundary.
- Chat and webhooks. JSON output drops straight into Slack, Teams, or PagerDuty without a translation layer.
- AI agents in the SDLC. AI coding agents - Claude Code, Cursor, the Anthropic and OpenAI SDKs - read terminal output natively. Giving an agent shell access to
krciturns the platform into a tool surface it can call: list codebases, inspect SBOMs, compare branches, summarize changes since the previous run. No MCP server to write, no proprietary protocol to learn, no stale API client to maintain.
The portal and the CLI are peers: the portal is the right interface for browsing, comparing, and approving; the CLI is the right interface for composing, scheduling, and handing off to agents. Both are first-class products and ship in lockstep.
The krci CLI as a Tool Surface
A short tour of the top-level surface, because this is what the agent has access to:
$ krci --help
Available Commands:
  auth        Authentication commands
  deployment  Manage deployments (CDPipelines)
  env         Inspect KRCI environments (Stages)
  pipelinerun Manage pipeline runs
  project     Manage projects (Codebases)
  sca         Inspect Dependency-Track projects, components, and vulnerability findings
  sonar       Inspect SonarQube projects, quality gates, and issues
  version     Print krci CLI version
When you run any of these commands - say, krci deployment list to inspect CD pipelines across your environments-the output follows the same disciplined structure. Columns are consistent, status values are predictable, and the table is human-readable and machine-parseable without any translation. Here's what that looks like in practice:
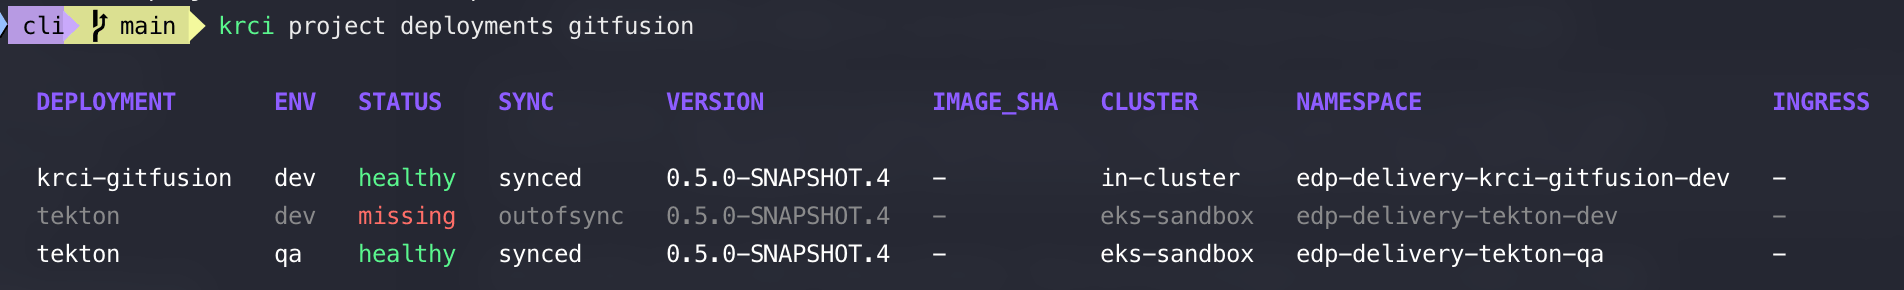
This table shows exactly what's deployed where. The VERSION column tracks the build artifact (0.5.0-SNAPSHOT.4), the ENV column shows which environment it's in, and the STATUS column tells you health at a glance -healthy or missing. The SYNC column flags when an environment has drifted (OutOfSync) from what GitOps expects. In seconds, you can answer: "What's actually running in qa? Is it in sync? What version?" The agent can answer it too, and answer the next question - "Show me all deployments older than 30 days" - without any special prompting.
Every group follows the same shape - list, get, sometimes a third verb - and the flags repeat (--branch, --severity, -o json|table). Predictability is the point: an agent can reason about the next command from the previous one, and so can I. Authentication is OIDC against the same Keycloak the portal uses; the agent inherits the existing session, so there is no long-lived API key embedded in any prompt.
Asking the Agent: "What's the Vulnerability Status of Our Operators?"
Here's a recent question, verbatim, from a Claude Code session:
"Using krci, give me the current vulnerability status of every operator registered on the platform. Main branch only, critical and high counts, top affected components per operator."
What the agent returned:
OPERATOR               CRIT  HIGH  TOP COMPONENTS (HIGH+)
cd-pipeline-operator     0     0   clean
codebase-operator        0     2   github.com/tektoncd/pipeline
keycloak-operator        0     0   clean
nexus-operator           0     0   clean
sonar-operator           0     0   clean
One row is doing all the work: codebase-operator master carries two high-severity findings, and both trace back to a single github.com/tektoncd/pipeline cluster. Everything else is clean. That's the kind of answer I can act on without scrolling - one operator, one component, one upgrade to plan.
The command I run by hand to verify the answer is one line:
$ krci sca list --page-size 500 -o json \
  | jq -r '.data.items[]
           | select(.name | endswith("-operator"))
           | select(.version == "master")
           | [.name, .metrics.critical, .metrics.high] | @tsv'
That's the whole loop. I described what I wanted in the language of the work, the agent shaped a krci invocation, and I can re-run any step independently to validate the result. No prior knowledge of jq flags, subcommand layout, or the platform's internal data model was required on my side.
Drilling In Stays in Plain Language
When a row of the answer needs follow-up, I keep the conversation going:
"Drill into
codebase-operatormaster - which components are driving those two highs?"
The agent's reply (verifiable by running the command yourself):
$ krci sca components codebase-operator --branch=master --severity=high
COMPONENT                       VULNS (C/H/M/L)
github.com/tektoncd/pipeline    0/2/4/0
One component, both highs, two natural-language turns, two commands. I never had to remember the flag shape; the agent bridged intent to invocation and the CLI's predictable output bridged invocation to answer.
The Same Pattern, Other Questions
Vulnerability status is one of many. The agent + CLI handle the same shape of question across the platform - I describe it in plain language, the agent runs krci, I verify the output against the platform:
- "Which pipeline runs failed in the last 24 hours, grouped by codebase?" →
krci pipelinerun list -o jsonfiltered on.status.conditions. - "Which environments are running an out-of-date image of
code-assistant?" →krci env list -o jsonjoined against the latest tag. - "What's the SonarQube quality gate state of every Java codebase?" →
krci sonar list -o jsonfiltered by language. - "Which projects on the platform haven't produced an SBOM yet?" → diff
krci project listagainstkrci sca list. - "Show me every CD pipeline whose latest deploy is older than 30 days." →
krci deployment list -o jsonfiltered on.status.lastDeploy.
Same pattern every time: ask in language, get an answer the CLI can verify, move on. The agent does the orchestration; the CLI does the work.
Making It Stick: Schedule, Script, Notify
The moment a question becomes recurring, it stops belonging in chat. The same krci invocation the agent assembled in the conversation becomes the body of a script:
#!/usr/bin/env bash
# Daily operator vulnerability digest - main branches only.
krci sca list --page-size 500 -o json \
  | jq -r '.data.items[]
           | select(.name | endswith("-operator"))
           | select(.version == "master")
           | [.name, .metrics.critical, .metrics.high] | @tsv' \
  | column -t
From there it's the standard fan-out:
- Cron or Kubernetes CronJob for a daily markdown digest in
~/reports/operators-$(date +%F).md. - Slack/Teams webhook for "first new critical on a release branch" alerts. Pipe the JSON through
jq, post on threshold. - Claude Code
/loopfor a six-hour heartbeat that reports only what changed:
/loop 6h  Run cli/scripts/operators-digest.sh and tell me ONLY what
          changed since the previous run. Reply in under 60 words.
Same script, same JSON, three runtimes. The CLI is unchanged; only the wrapper changes.
Why the krci CLI Works Well as an Agent Tool Surface
Three properties matter, and each one comes from deliberate design rather than accident:
- Stable, structured output.
krci ... -o jsonis shaped consistently across releases. The agent doesn't need a parser; it navigates JSON. - Identity is solved upstream. OIDC sessions are inherited from the developer's existing login. No API keys leak into prompts, transcripts, or scripts.
- Predictable verb shape.
list,get, sometimes a third verb, with the same flags everywhere. The agent generalizes from one command to the next, and so do humans.
The result is that the conversation with the agent stays in the language of the work - "vulnerability status of operators", "failed runs in the last 24 hours", "environments running an out-of-date image" - and the CLI handles the translation. Both pieces are independently inspectable: I can replay any command myself, the agent can replay it tomorrow, and the script that captures a routine is short enough to review in one sitting.
Honest Notes Before You Adopt the Pattern
A few things I learned the slightly hard way:
- Not every codebase produces an SBOM yet. Some appear in
project listbut are absent fromsca listbecause no CycloneDX upload has happened on their build pipelines. The CLI surfaces the gap rather than hiding it, which is itself useful, but means agent answers should always cross-check both lists. - Cross-project aggregation sometimes still uses a shell loop. There's no
krci sca list --filter='critical>0'flag yet - native flags are on the roadmap, the agent compensates in the meantime. - BOM age (
Last BOM) shows up inkrci sca getbut not onsca list. If staleness matters to your routine, pin it explicitly in your script.
I include this list because tools earn trust by being honest about what they don't do yet.
Try It Yourself
- Install krci from the release page and run
krci auth login. - Open your AI assistant of choice, give it shell access, and ask your own version of the question above. Anything along the lines of "using krci, show me the vulnerability status of every operator on the platform, main branch only" will work on day one.
- When the answer becomes a routine, drop the underlying command into a script and run it on cron, a CronJob, or
/loop.
That's the entire loop: ask in language, get an answer the CLI can verify, schedule it when it matters.
Further Reading
- krci CLI on GitHub - command reference, authentication setup, and release binaries.
- SCA with Dependency-Track - how SBOMs reach the platform.
- Kubernetes-Native CI/CD with Tekton - the pipeline layer that produces those SBOMs.
- CycloneDX SBOM, Dependency-Track, and Claude Code - the upstream tools used in this post.
The krci CLI is open-source under Apache License 2.0. Source, issues, and release binaries live on GitHub.