Pipeline Monitoring with Prometheus and Grafana
This documentation describes how to integrate tekton-pipelines metrics with Prometheus and Grafana monitoring stack.
Prerequisites
Ensure the following requirements are met first before moving ahead:
- Kube prometheus stack is installed
- Tekton pipeline is installed
Integration Overview
Currently, there are two methods for integrating tekton-pipelines metrics with the Prometheus and Grafana monitoring stack.
Integration via Service Monitor
To implement Pipeline Monitoring using the Service Monitor resource, follow the steps below:
-
Create a Service Monitor resource file with the following configuration:
apiVersion: monitoring.coreos.com/v1kind: ServiceMonitormetadata:labels:release: prom # kube-prometheus-stack release namename: tekton-overviewspec:endpoints:- interval: 10spath: /metricsport: http-metricsscrapeTimeout: 10snamespaceSelector:matchNames:- tekton-pipelinesselector:matchLabels:app.kubernetes.io/component: controllerapp.kubernetes.io/part-of: tekton-pipelines -
Apply the created resource to the
tekton-pipelinesnamespace:kubectl apply -f service-monitor.yaml -n tekton-pipelines -
Download the KubeRocketCi dashboard:
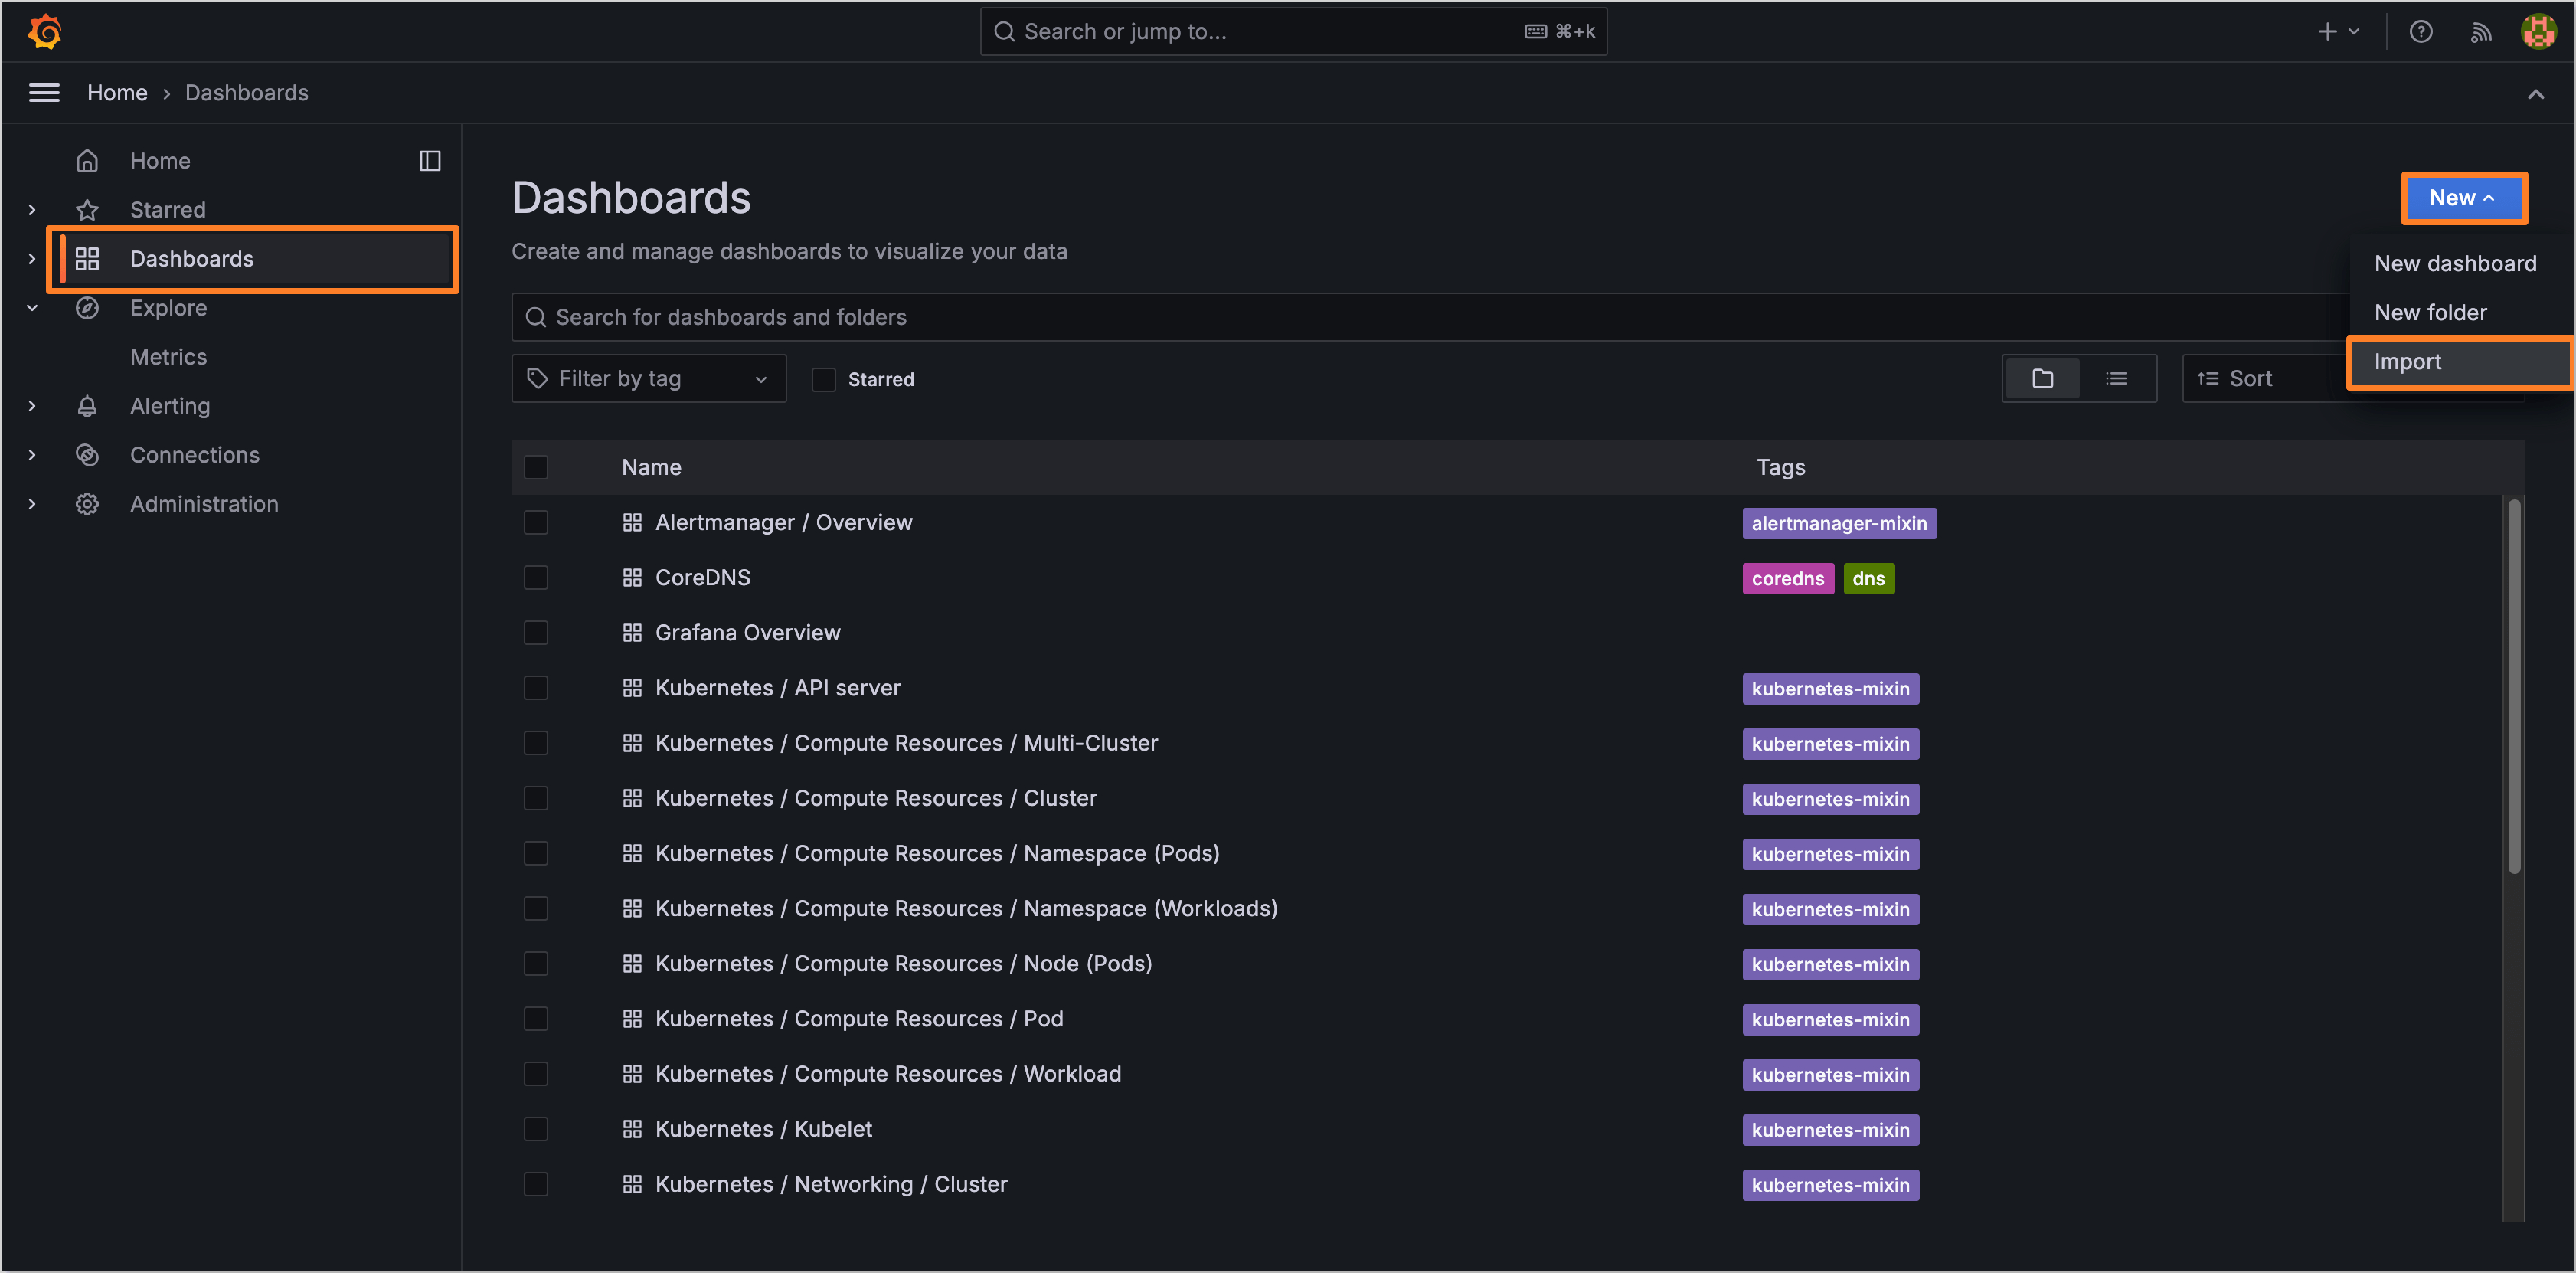
a. Click on the dashboard menu.
b. In the upper right corner, click on the
Newbutton. In the dropdown menu, click theImport:
c. Select the downloaded
18321_rev*.jsonfile:
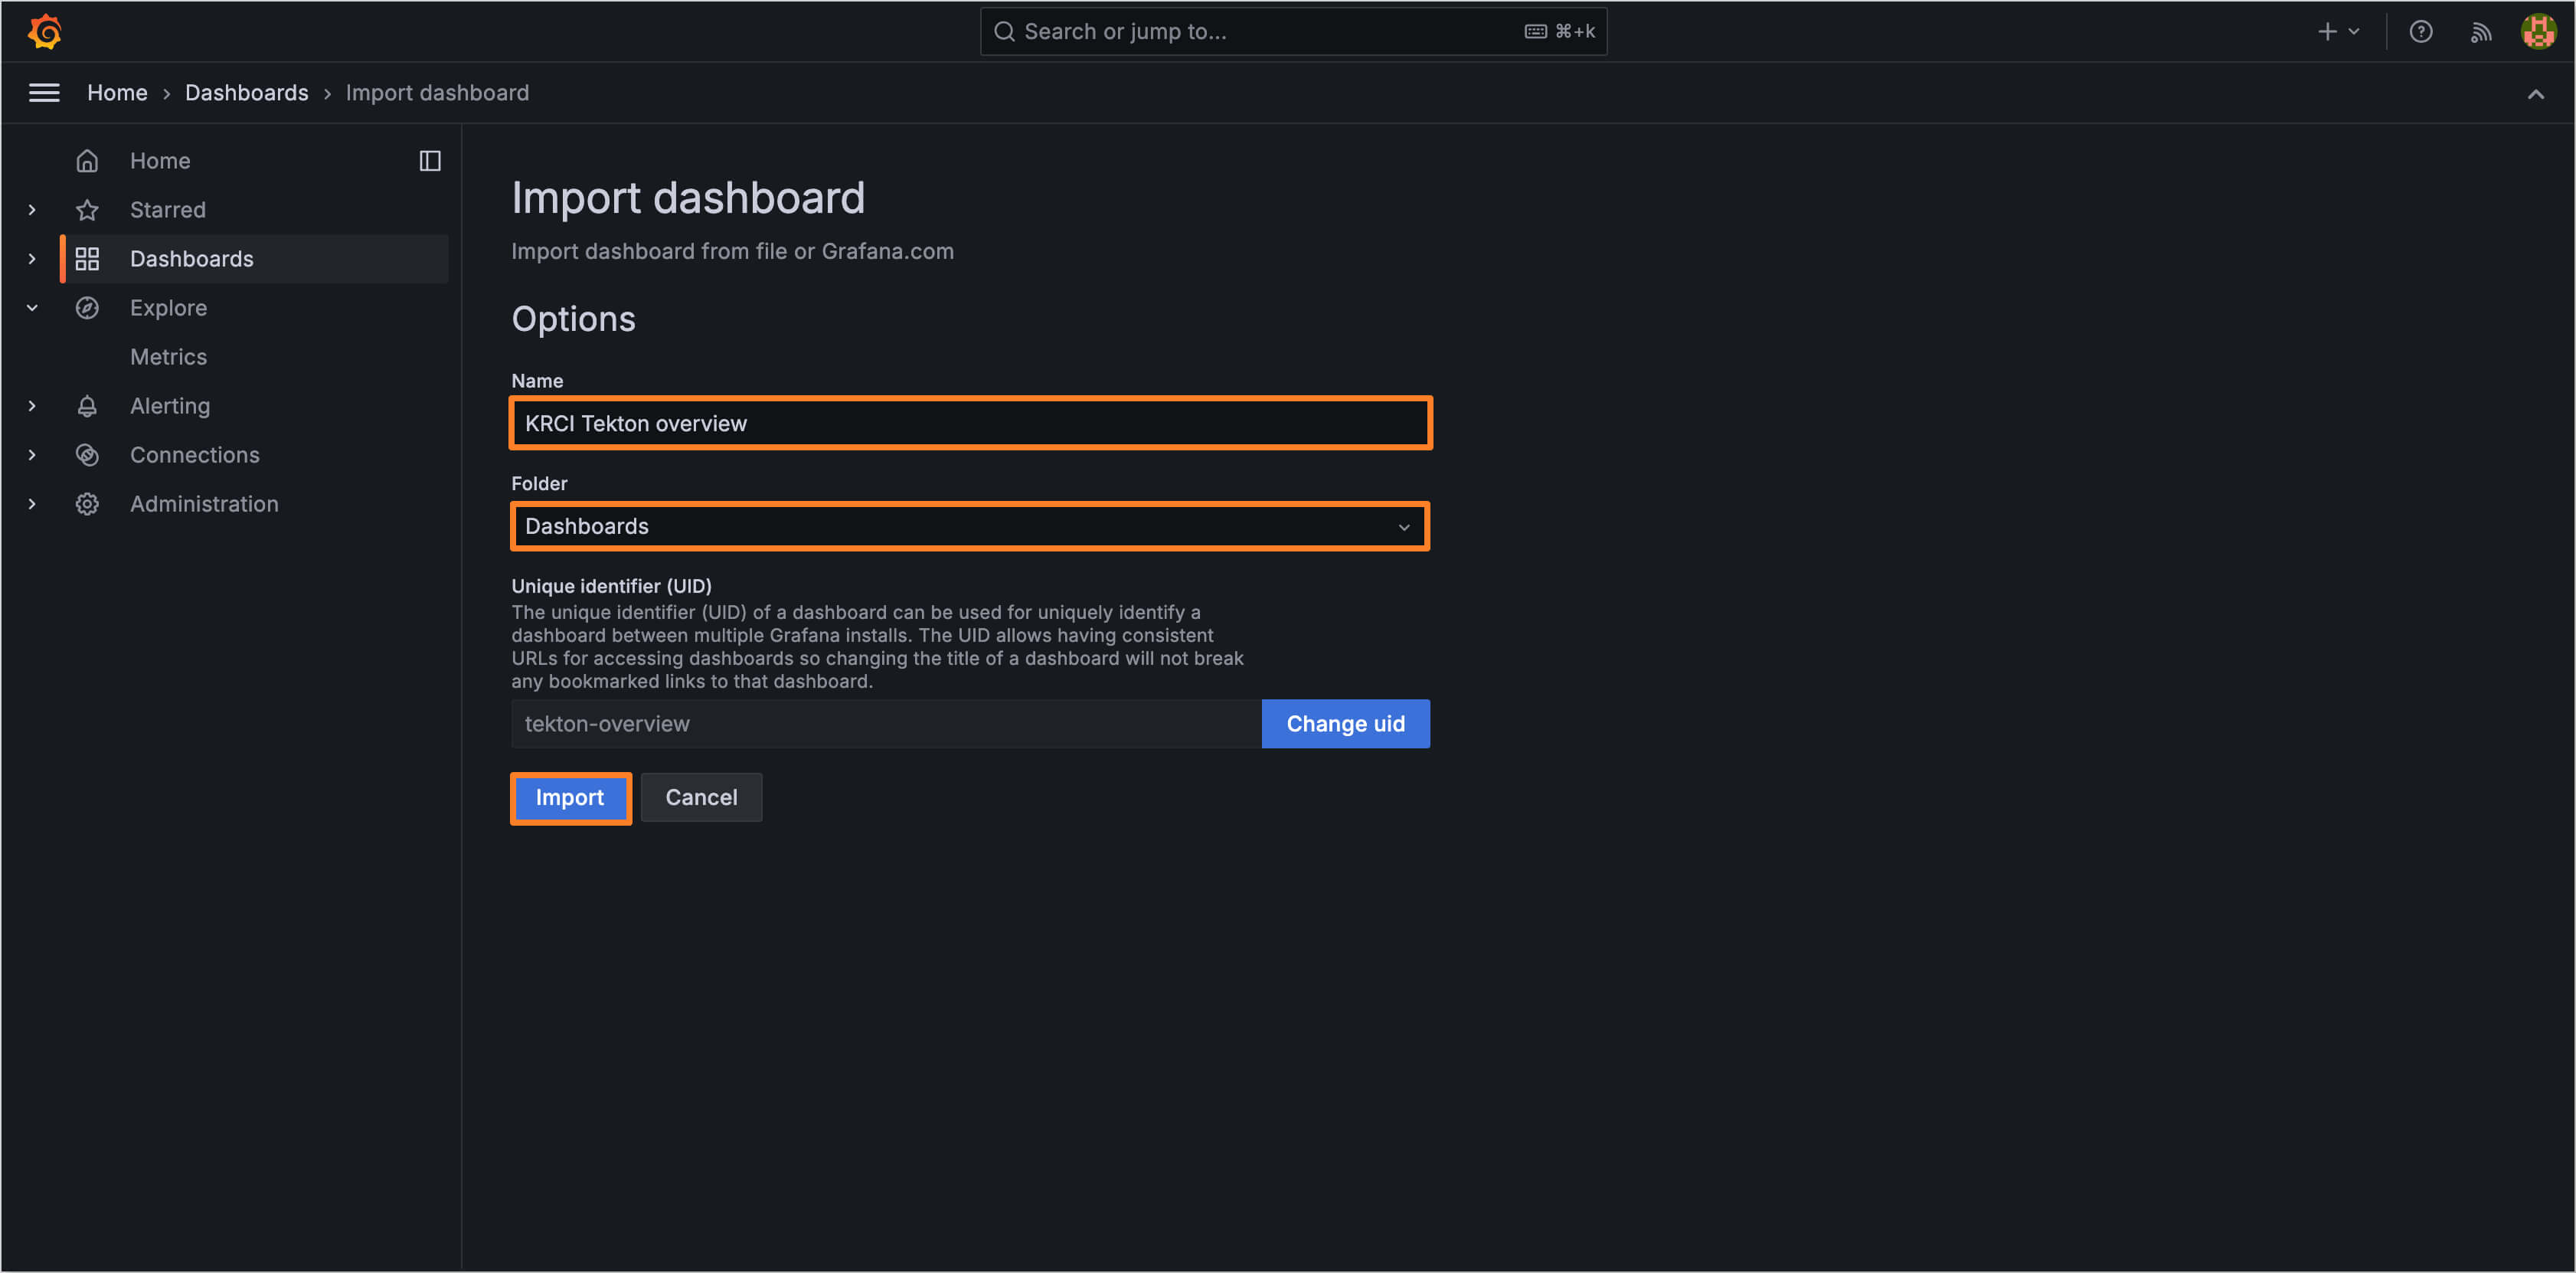
d. Type the name of the dashboard.
e. Select the folder for the dashboard.
f. Change the UID if necessary.
g. Click the
Importbutton.
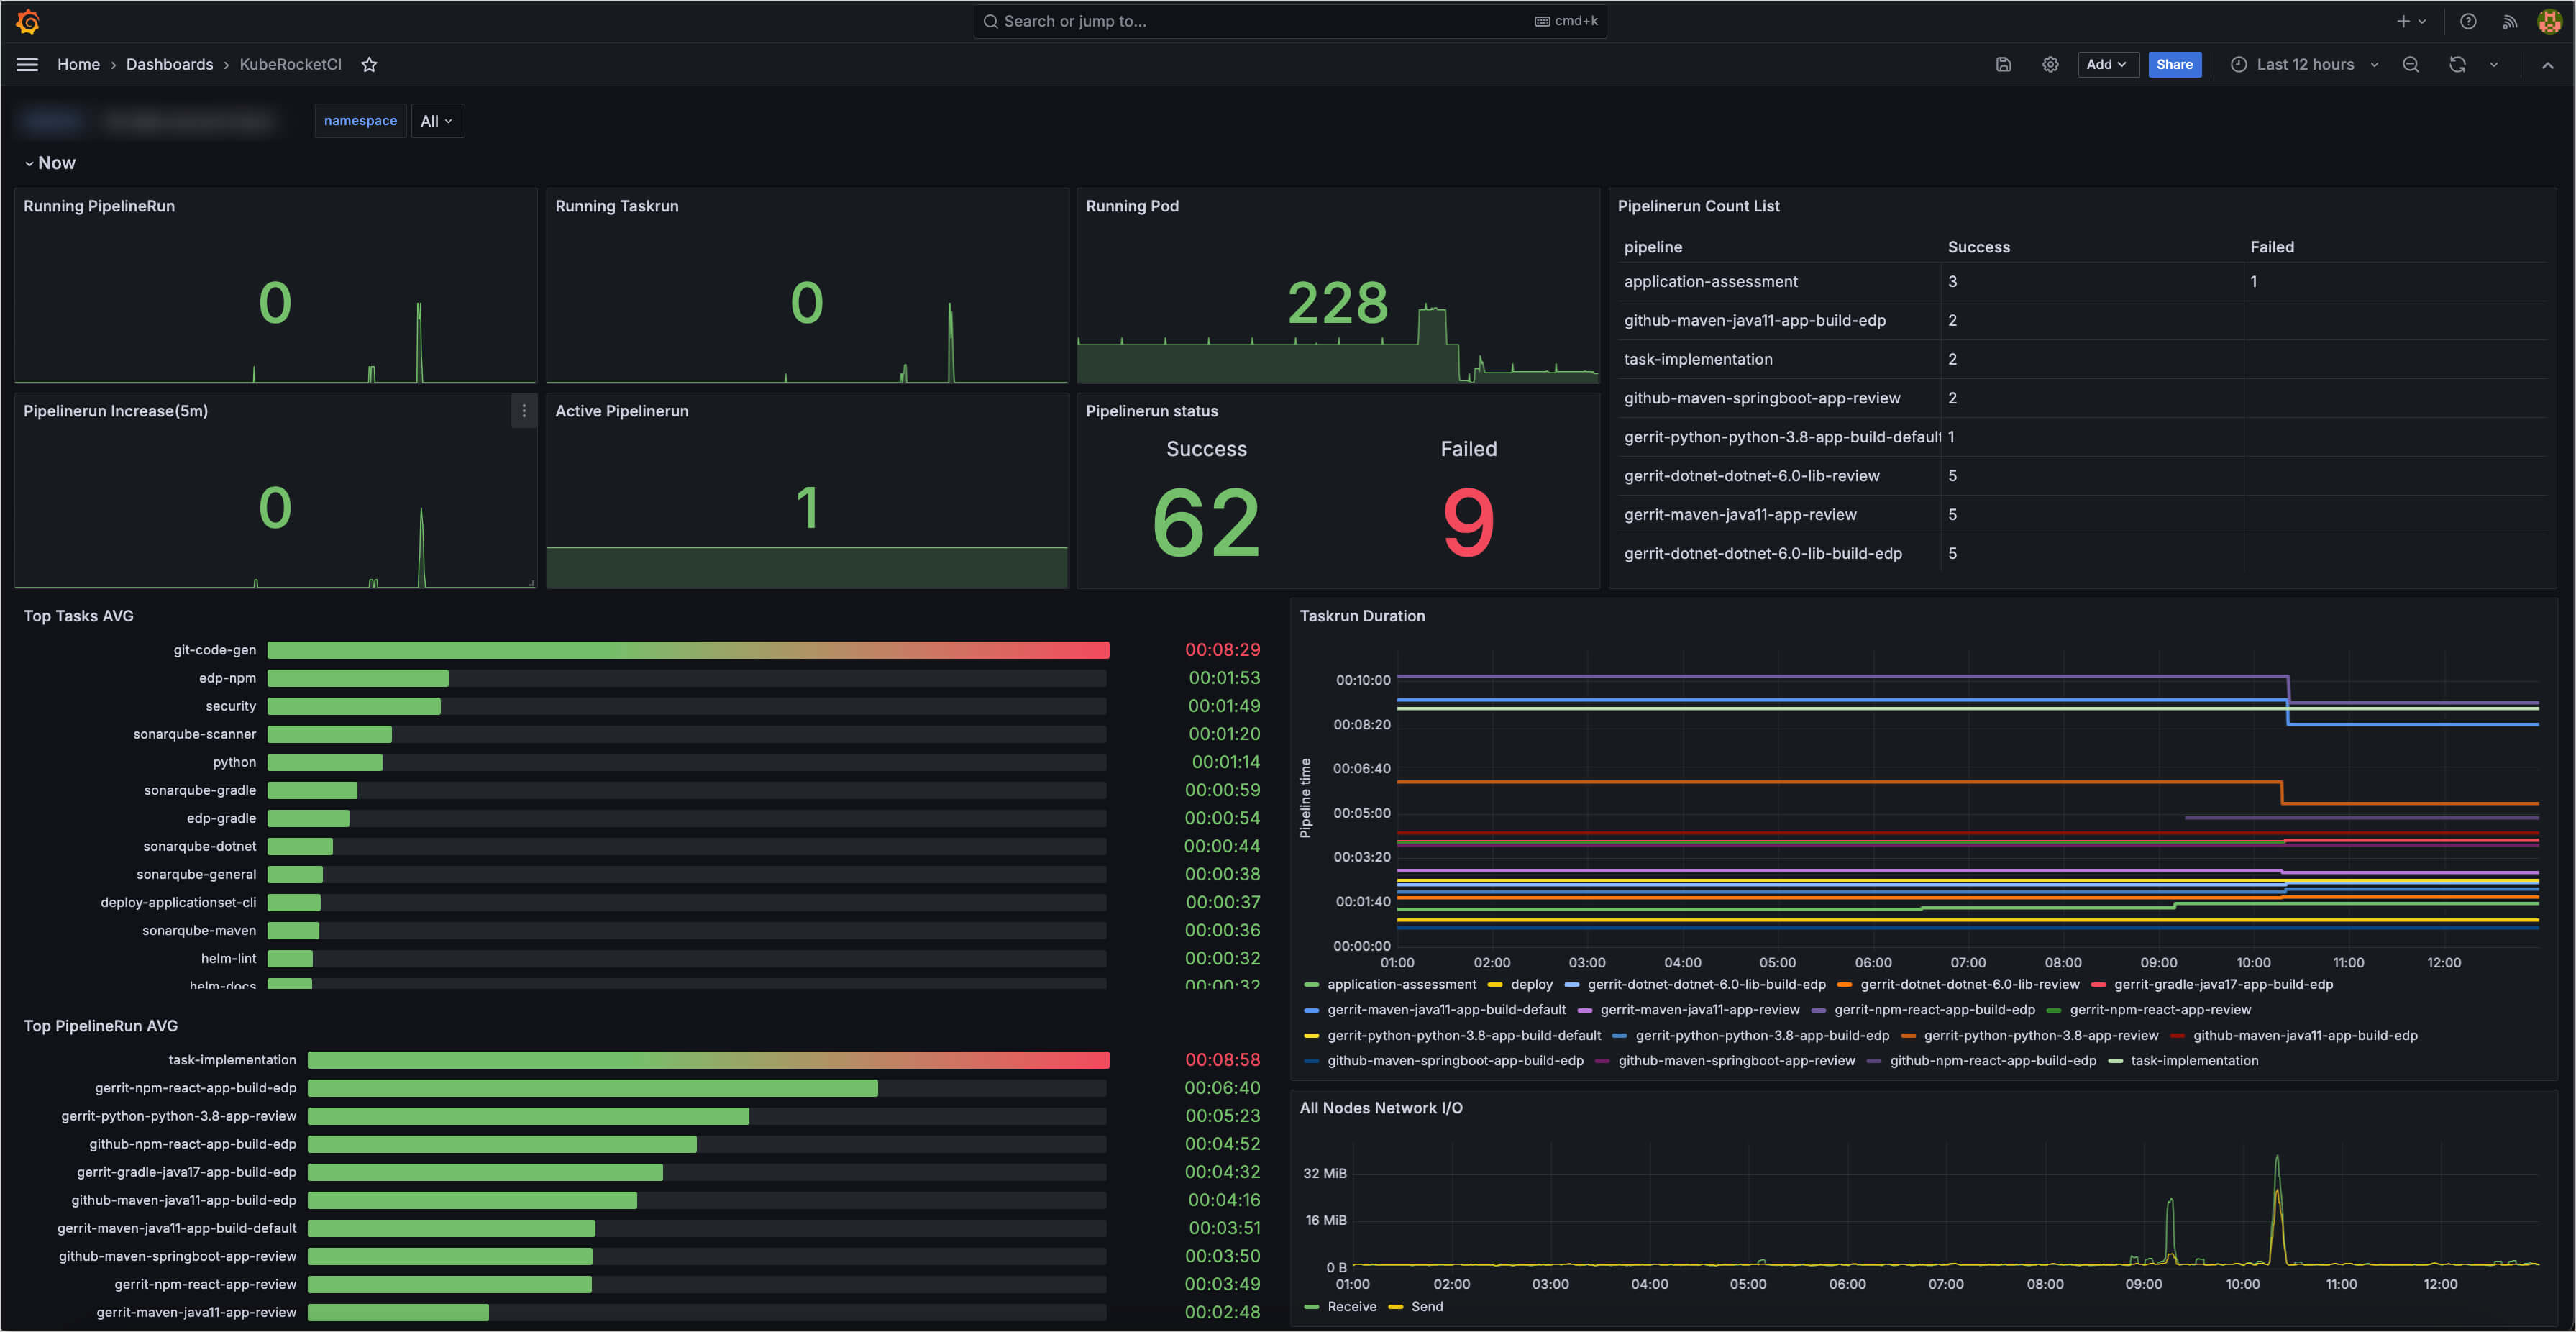
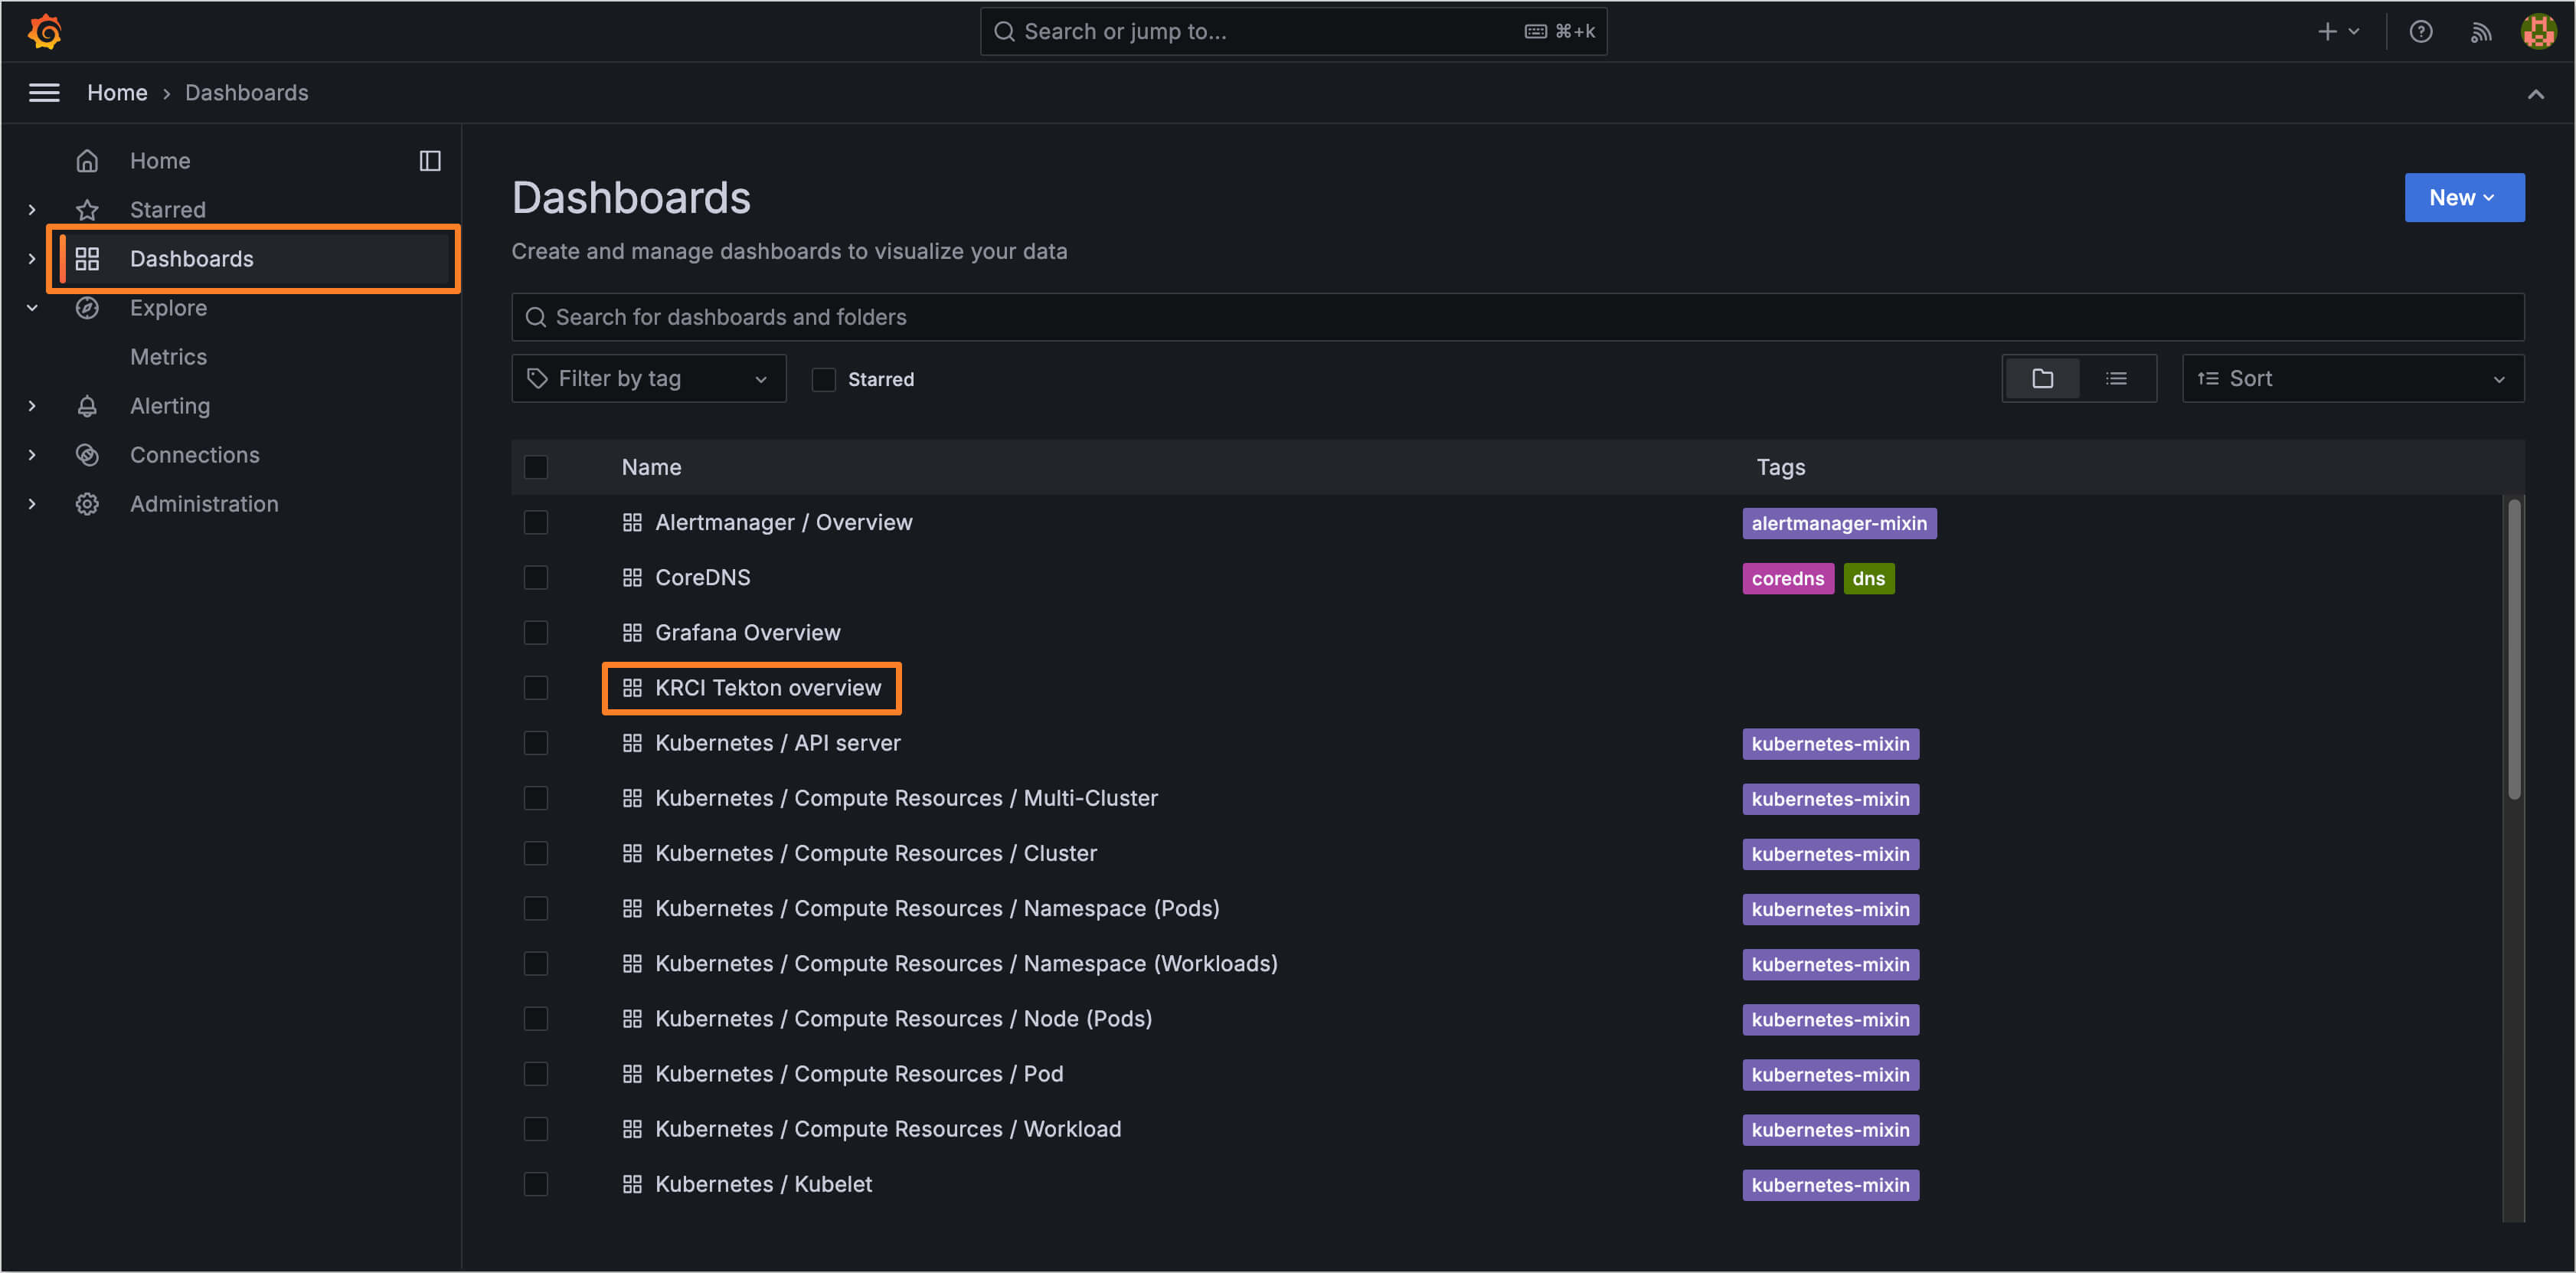
As soon as the dashboard procedure is completed, you can track the newcoming metrics in the dashboard menu:

Integration via edp-install Helm Chart
The edp-install helm chart allows to integrate tekton-pipelines metrics with the Prometheus and Grafana stack through the edp-tekton.grafana.enabled field in values.yaml file.
To enable integration, set the edp-tekton.grafana.enabled field to true and apply the changes to the cluster.
edp-tekton:
  grafana:
    enabled: true
After the changes are applied, the tekton-pipelines metrics will be available in the KRCI Tekton overview Grafana dashboard:
