How to View Grafana Metrics for an Application?
There are two ways to access the Grafana service:
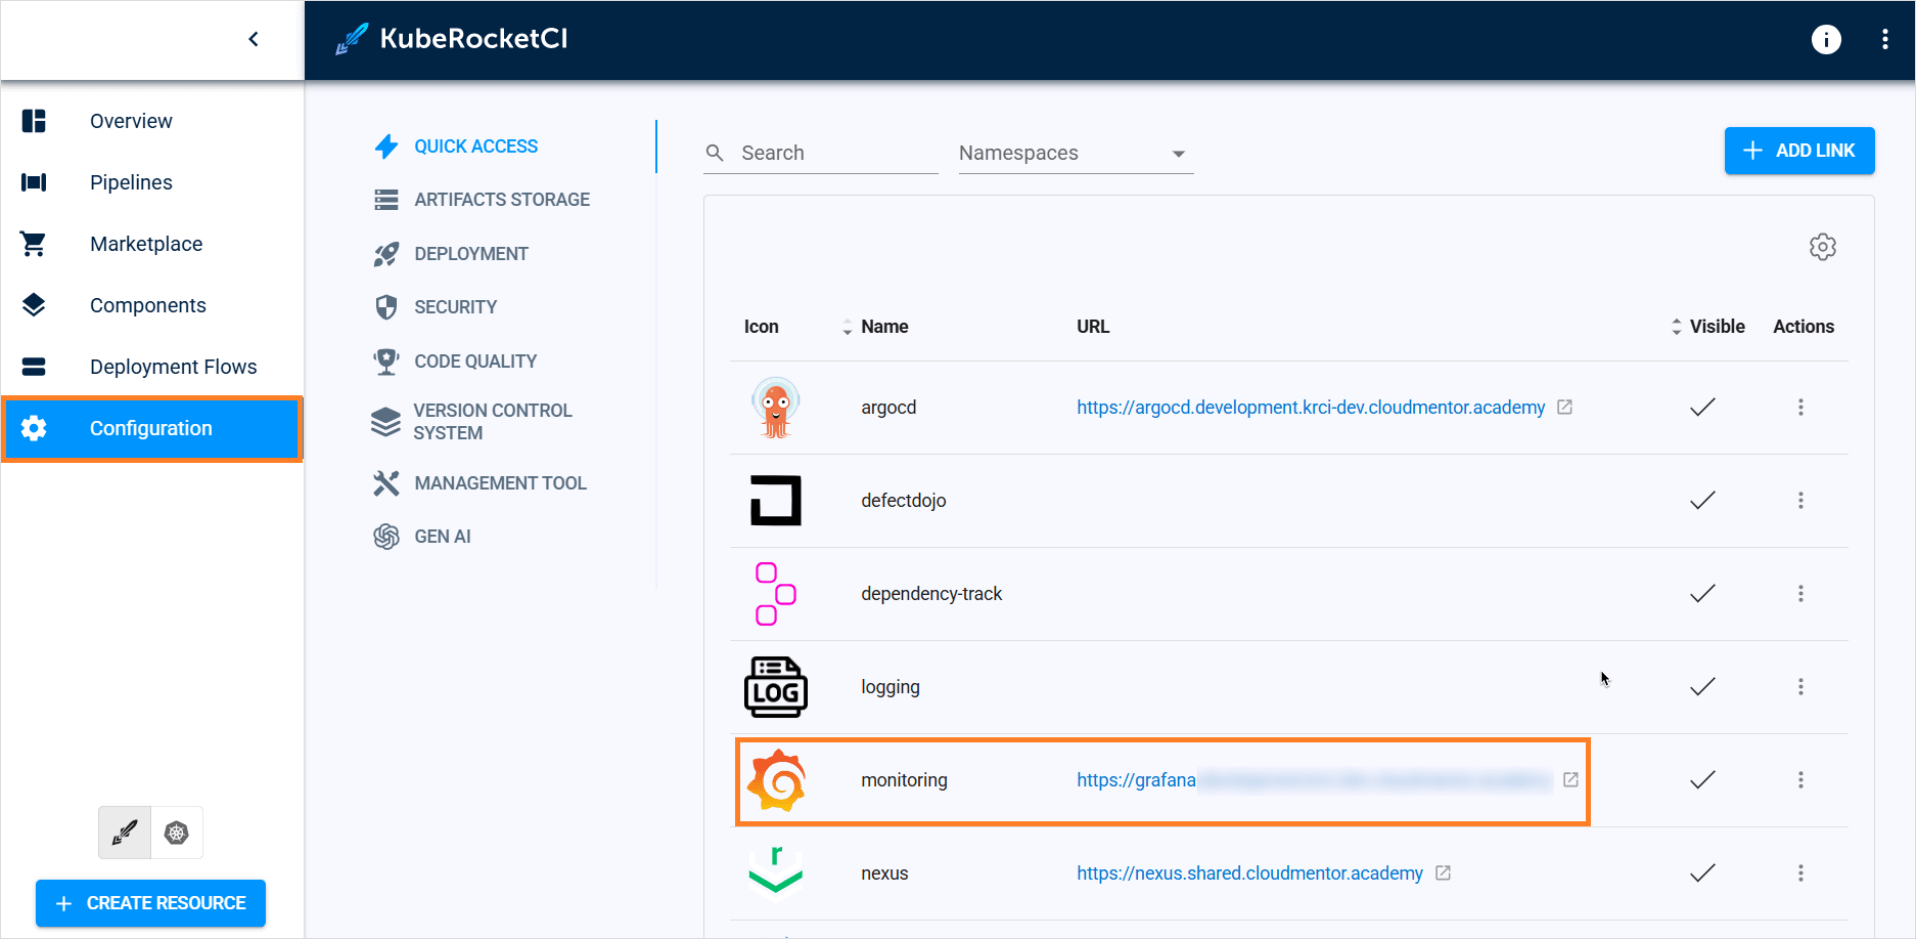
- To find the Grafana service, navigate to Configuration → Quick Access → Links → Monitoring:

You might be asked to log in to the service.
- You can also get a built-in Grafana Dashboard for the deployed application. Refer to the Manage Deployment Flows page for more details.